Solana Market Maker Cookbook: Bot Settings for 6 Chart Scenarios
How trading bots shape memecoin charts on Solana: six ready-made Auto BUY / Auto SELL setups for the ChainTx.Tools Market Maker, what each one costs, and how traders can recognise the same patterns on the chart and on-chain.
 Antonio Vaganovs·Published ·Updated ·11 min read
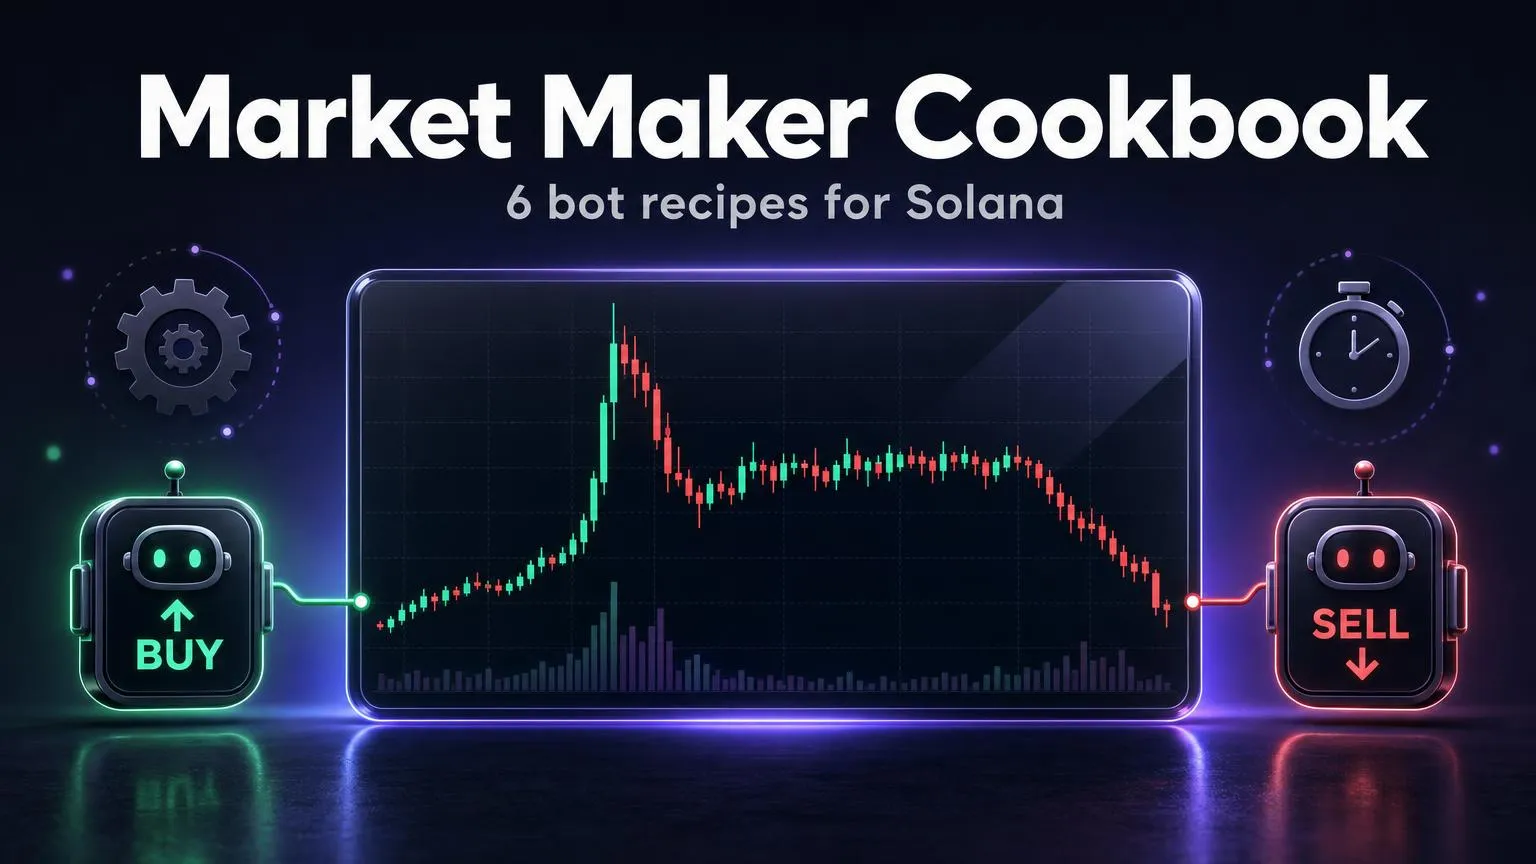
The price chart of a Solana memecoin is not only the sum of what thousands of independent traders do. Very often a large share of the candles comes from trading bots that buy and sell on a schedule from dozens of wallets. Understanding how those bots work is useful from both sides of the market: a token creator learns how to set up liquidity and trading activity, and a trader learns what may be hiding behind a "perfect" chart.
This guide walks through six classic scenarios using the ChainTx.Tools Solana Market Maker: which settings produce each chart shape, what it costs, and how the same pattern looks from the trader's point of view.
How the Market Maker works
The Market Maker trades from your own wallets. You paste their private keys into the Market Maker Private Keys (Base58) field, one per line; the keys stay in your browser and are never sent to our server. Wallets are easy to prepare in bulk: create them with the Bulk Wallet Creator and fund them with SOL through One-to-Many.
There are two independent bots: the Auto BUY Bot and the Auto SELL Bot. Each one runs its own loop: on every tick it picks one wallet, makes one swap, and waits for the next tick. The direction of the price is therefore decided by the balance between the two loops — how often and how much each of them trades.
| Setting | What it controls |
|---|---|
| Timer (Seconds) | The pause between bot trades: fixed (for example, every 15 seconds) or random within a min–max range |
| Amount Mode | The trade size: fixed, random between a minimum and a maximum, or percent of the wallet's balance. Buys are measured in SOL, sells in tokens |
| Wallet Order Strategy | Which wallet trades next: Random, Sequential, Last Buy Time / Last Sell Time (the wallet that has been idle longest goes first), or sorted by SOL or token balance |
| Stop Conditions | Automatic stop after N runs, at a target USD price or market cap, or when the total SOL or token balance crosses a threshold |
| Slippage (%) and Delay between txs (ms) | Protection against price movement during execution and pacing of requests to the RPC node |
Percent scales with each wallet's balance, so one setup works for wallets of different sizes. Random sets an exact range in SOL or tokens and gives finer control. The recipes below use percent; if you prefer random, convert the percentage into the same share of a typical wallet's balance. In percent mode the bot always leaves 0.005 SOL in each wallet for network fees.
Before you start
- Wallets and SOL. Load the wallets, wait until the table shows their SOL and token balances, and make sure every wallet has SOL for fees.
- RPC node. For a bot that sends a transaction every few seconds, use a premium RPC endpoint (configured in RPC Nodes). Public endpoints quickly hit rate limits, and trades start to fail.
- DEX and pool. Jupiter is recommended: it routes every trade through the best available pool. Tokens still on the Pump.fun bonding curve are supported too, and the Market Data block shows the Bonding Curve Progress.
- Slippage. 5–30% for volatile coins, 1–3% for calmer ones.
- Stop Conditions. Set them before you start: at minimum a market-cap target and a minimum total SOL balance. A bot left without limits burns through the budget faster than you expect.
- Test run. Make one small trade in Manual Control mode to confirm that the pool, slippage and RPC all work.
Cheat sheet: six scenarios
| Scenario | Auto BUY: timer | Auto BUY: size | Auto SELL: timer | Auto SELL: size |
|---|---|---|---|---|
| 1. Gradual uptrend | random 15–45 s | 3% of SOL | random 40–90 s | 2% of tokens |
| 2. Fast uptrend (pump) | random 2–10 s | 15% of SOL | random 120–300 s | 1% of tokens |
| 3. Gradual downtrend | random 40–90 s | 2% of SOL | random 15–45 s | 4% of tokens |
| 4. Fast downtrend (dump) | off or 120–300 s | 1% of SOL | random 2–10 s | 20% of tokens |
| 5. Sideways range | random 10–30 s | 4% of SOL | random 10–30 s | match the buy volume |
| 6. Sell all | stopped | — | stopped | Manual SELL, 100% |
The logic behind every row is the same: pressure = average trade size × trades per minute. For example, buying 3% of 1 SOL every 30 seconds on average is about 0.06 SOL of buying per minute. If selling adds up to less in SOL terms, the price drifts up; if more, it drifts down; if roughly equal, it moves sideways.
1. Gradual uptrend

On the chart: steady growth with regular pullbacks. Green candles are slightly more frequent and slightly larger than red ones.
Why it works: buys happen about twice as often as sells and are a little bigger, so net buying pressure lifts the price slowly while the sells keep the chart moving in both directions.
- Timer: random, 15–45 s
- Amount Mode: percent — 3% of SOL balance (or random, about 2–5%)
- Wallet Order Strategy: Random
- Timer: random, 40–90 s — less often than buys
- Amount Mode: percent — 2% of token balance (or random, about 1–3%)
- Wallet Order Strategy: Random
A smooth "staircase" without news, where trades of similar size arrive at fairly regular intervals and many wallets trade only this token, is the typical signature of a bot. It does not mean the project is bad, but it does mean that the chart reflects someone's settings rather than real demand.
2. Fast uptrend (pump)

On the chart: a sharp spike made of tall green candles with almost no pullbacks.
Why it works: large buys every few seconds and almost no selling pressure. On a thin pool every next buy moves the price more than the previous one.
- Timer: random, 2–10 s — very high frequency
- Amount Mode: percent — 15% of SOL balance (10–25%)
- Wallet Order Strategy: Random
- Timer: fixed or random, 120–300 s
- Amount Mode: percent — 1% of token balance (micro-sells only)
- Wallet Order Strategy: Random
This is the most expensive scenario: the SOL in your wallets runs out within minutes, and every next buy happens at a worse price. Be sure to set Stop if USD Market Cap >= and Stop if Total SOL Balance < before you start.
Vertical candles with no news, buys from wallets that were funded minutes earlier from the same source, and almost no sells. The tokens bought this way are usually sold at the top later — see scenarios 4 and 6.
3. Gradual downtrend

On the chart: a slow decline with lower highs and lower lows, without a single crash candle.
Why it works: sells are more frequent and larger than buys, but each one is small. Splitting a big position into many small sells keeps the price impact of each trade low — the same idea as a TWAP order on a centralized exchange. This is how large holders exit a position without crashing the price with one candle.
- Timer: random, 40–90 s
- Amount Mode: percent — 2% of SOL balance (1–3%)
- Wallet Order Strategy: Random
- Timer: random, 15–45 s
- Amount Mode: percent — 4% of token balance (3–6%)
- Wallet Order Strategy: Random
A steady "bleed" with constant selling while trading volume stays high and the number of holders does not grow. Check the top holders on Solscan: if their balances shrink day after day, someone is distributing their position.
4. Fast downtrend (dump)

On the chart: a sharp drop made of long red candles.
Why it works: large sells at very short intervals, while buying is switched off or runs only in the background.
- Timer: off, or random 120–300 s
- Amount Mode: percent — 1% of SOL balance (only to keep some volume)
- Timer: random, 2–10 s
- Amount Mode: percent — 20% of token balance (15–30%)
- Wallet Order Strategy: Sequential or Random
Every next sell fills at a worse price than the previous one. A fast exit realises much less SOL than the gradual one in scenario 3 — sell this way only when speed matters more than the result.
When large holders exit like this, a tight slippage setting will not save you — your sell simply fails while the price keeps falling. Before buying, check how much of the supply sits in a handful of linked wallets.
5. Sideways range

On the chart: the price stays inside a narrow corridor while trading continues.
Why it works: both bots trade at the same rate and with a similar SOL value, so buys and sells cancel each other out.
- Timer: random, 10–30 s
- Amount Mode: percent — 4% of SOL balance (3–5%)
- Wallet Order Strategy: Random
- Timer: random, 10–30 s — the same as buys
- Amount Mode: percent — start with 3–5% of token balance and adjust until the sell value matches the buy value
- Wallet Order Strategy: Random
When the same person trades on both sides between their own wallets, the resulting volume does not reflect real interest in the token — this is wash trading. Many exchanges and regulators treat it as market manipulation, and analytics services such as DexScreener and Bubblemaps increasingly flag linked wallets. It also costs money: every round trip pays the pool fee twice, plus the service fee.
High volume with a flat price, a flat number of holders and few unique "makers" relative to the number of transactions. On DexScreener compare the count of transactions with the count of makers; on Bubblemaps look for wallet clusters funded from one address.
6. Sell all

On the chart: one giant red candle that wipes out the whole rise.
How it is done: stop both bots, switch to Manual Control and sell 100% of the tokens from every wallet at once.
- Press STOP BUY BOT
- Press STOP SELL BOT
- Amount Mode: percent — 100%
- Press Bulk Sell: the sell runs from every loaded wallet in parallel
To clean up every token left in the wallets in one go, there is also a separate Sell All Tokens tool.
This is the "rug" candle. The main risk factor is concentration of supply: if a large share of tokens sits in wallets controlled by one person, such a candle can appear at any moment.
How much it costs
Each bot trade is a real on-chain swap, and it pays:
- the network fee — the base fee plus the priority fee (Compute Unit Price) you set;
- the DEX pool fee — usually from 0.25% to 1% of the trade, depending on the DEX and the pool;
- the ChainTx.Tools service fee — up to 1% of the trade;
- price impact and slippage — the larger the trade relative to the pool's liquidity, the higher the loss.
A rough formula: cost ≈ trading volume × (pool fee + service fee) + number of transactions × network fee. For example, in scenario 5 with an average of 20 seconds between trades on each side, the bots make about 360 trades per hour. With an average trade of 0.05 SOL that is about 18 SOL of volume, and at a combined 1.25% in fees about 0.23 SOL per hour — before network fees and price impact. The faster and larger the trades, the faster the budget goes.
How to tell bot activity from organic demand
This checklist is useful for traders and creators alike — it is exactly what an attentive buyer will look at:
- Timing. Trades arrive at suspiciously regular intervals, around the clock, including at night.
- Sizes. Many trades have nearly identical amounts or tidy percentages of a balance.
- Wallets. Lots of new wallets funded from the same source shortly before their first trade. Solscan shows where a wallet's SOL came from; Bubblemaps draws these links as clusters.
- Holders vs. volume. Volume grows, but the number of holders stays the same.
- Makers. On DexScreener there are few unique makers compared with the number of transactions.
- Chart patterns. On illiquid tokens, classic technical-analysis figures — a bull flag, a cup and handle, an ascending triangle — can be drawn by bots on purpose, precisely because traders react to them. On small memecoins, technical analysis alone is not a reliable signal; always confirm it with on-chain data.
- Token and liquidity rights. Check that the mint and freeze authorities are revoked and that the liquidity is locked or burned.
Summary
The Market Maker turns a few parameters — the timer, the trade size and the wallet order — into a predictable chart shape. A gradual rise, a pump, a slow distribution, a dump, a flat range and a full exit are all the same two loops with different settings. For a creator this is a manual for planning budget and risk; for a trader it is a way to read the chart critically and check what the candles actually show before buying.
FAQ
+Is a market maker the same as a volume bot?
Technically, yes: both make real swaps from your wallets on a schedule. The difference is in the settings. When buys and sells are balanced, the bots mostly add volume (scenario 5); when one side outweighs the other, they move the price (scenarios 1–4).
+How many wallets do I need?
The Market Maker works with any number of wallets. More wallets let the Wallet Order Strategy spread trades across addresses, but every wallet needs its own SOL for fees — in percent mode the bot always leaves 0.005 SOL in each one.
+Why did the bot stop on its own?
Usually for one of three reasons: one of the Stop Conditions was met, the wallets ran out of SOL (for buys) or tokens (for sells), or the RPC node started rejecting requests. Check the logs, top up the wallets and use a premium RPC endpoint.
+Does it work with Pump.fun tokens before they migrate?
Yes. Tokens on the Pump.fun bonding curve are supported, and the Market Data block shows the Bonding Curve Progress, so you can see how close the token is to migrating to a DEX pool.
+How much does running the bots cost?
Every trade pays the network fee, the DEX pool fee (usually 0.25–1%) and the ChainTx.Tools service fee of up to 1%, plus price impact. A rough estimate: trading volume × (pool fee + service fee) + number of transactions × network fee.
+Is using a market-making bot legal?
It depends on the jurisdiction and on how it is used. Trading against yourself to create fake volume (wash trading) and coordinated pump-and-dump schemes are prohibited in many countries and by many platforms. This guide explains the mechanics for educational purposes and is not legal advice.